
First things first, nothing in this post works if you don’t have a documented content strategy connected to clearly defined business goals. Your strategic goals will determine your key performance indicators, or KPIs, and let you know what it is you need to be measuring.
Looking at your data and creating reports and dashboards without having your strategic goals identified is like driving in your car without a destination. It’s great to go out on a beautiful day and just drive around, but we don’t do that very often because we usually have somewhere we want to go.
Your KPIs are the road signs and mile markers along your journey that will let you know whether or not your content is moving you in the right direction and how close you’re getting to your destination. Once you know what you should be looking at, you can figure out how to reach your destination more quickly.
You need to start off by establishing baselines with this data so you know where you currently are. You can look back at your historical data to see how far you’ve already come and how fast you’re moving towards your goals.
Finally, you need to really understand your audiences and all of your channels. There are lots of different roads you can travel to reach your destination and lots of people you can talk to along the way but you have to know which kinds of people are on which roads and what questions those people have so that you know what information to give them to convince them to get into your car and come with you.
Those are the first steps. If you haven’t firmly identified your goals, KPIs, and audiences, you won’t know if the data that you’re looking at has any importance or relevance for reaching your final destination.
This post title refers to “data inspired content” versus “data-driven content” because you don’t want to remove the intelligent decision making that must go on around your data. You can’t just look at the data and make a decision about changes to your content strategy based on one set of numbers. You have to consider the larger implications of that data when it’s held up against other data points, your strategic initiatives, and your user needs.
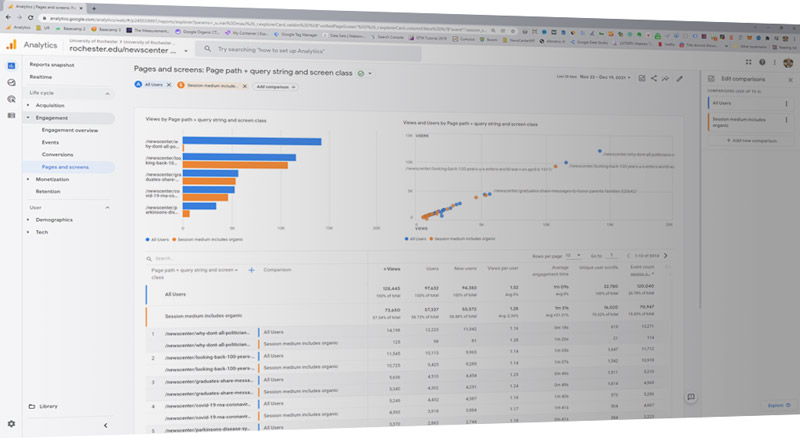
Let’s talk a little about the data for different channels and some things you might want to look at. The first collection of data you should be looking at is your website data.
Website Data
I did an SEO workshop a few years ago and a couple months after the workshop I got a call from one of the attendees who said they were working on a complete website redesign and was wondering if I could help with some SEO for the new site. I said sure, when does the new site launch. They said tomorrow. So, I ran a bunch of audits on the existing site, got a bunch of data about search positions and high performing pages and the next day, when the new site was up, I re-ran those audits, looked at the data and called them immediately to tell them that they could lose up to 30,000 visitors/month because of a few key pages that they removed. Needless to say, they added those pages back in and hired me to do a complete redesign evaluation for them and help them out with their analytics and optimization.
We use data to inform many decisions that we make. It makes our lives much easier when we need to measure progress. So why wouldn’t you use data to inform decisions you’re going to make about your largest window to the world.
If you or the company you work for have a website and you’re not doing regular audits to look at key components of your site, you may be missing opportunities to increase the performance of the site, improve the user experience or drive more traffic and conversions.
We tend to spend lots of time focused on adding new content to our sites or tracking how many people are making purchases or consuming content on our sites without really considering the underlying performance issues, content organization problems and search potential that may be affecting or driving those numbers.
Social Channel Data
The analytics included with different social channels can provide numerous insights to help you optimize your social media content strategy.
Most social tools will provide data that can help you make decisions about the best day or time to post based on the engagement around previous posts and they are good at presenting information about the most effective posts, engagement rates, etc. for each month.
However, they often don’t provide the opportunities to do a deeper dive into the data to get more specific and custom KPIs you may actually need to know if you’re leveraging the social channel to its full potential.
To find these insights, you need to export the data from the social channels into Excel, aggregate it together so that you can look at long term performance, track custom elements and perform more in-depth analysis.
For example, you can look at your social data to see how many new followers you have or which post has the highest engagement. But, without putting your data into a spreadsheet and adding in custom fields, you won’t be able to learn which strategic topics perform best on which channel with the different audiences.

Email Data
Email and newsletters are amazing tools to communicate directly with your community and collect very specific data on how they consume and view your content. If you put out a newsletter, be sure you use UTM codes on all the links that go to your website so you can track the activity of each user when they click on those links and visit your pages.
If you are using an email management tool (MailChimp, Emma, etc.) you can get specific data on open and click-through rates but those metrics won’t connect through to your Google Analytics goals and conversions without some work on your part unless you’re using a CRM or marketing automation tool that allows you to connect that data.
Also, if you suddenly get a big spike in email subscriptions, you want to be able to look across your content landscape to determine where they came from. Did you have a tweet with high engagement that same day? Were you a host on a podcast?
Your newsletter metrics won’t have that information, but it’s easy enough to enter that data into a spreadsheet and connect those two datasets yourself and then find that connection.
Podcasts/Videos
There is a lot of data available from podcasts and videos including number of views, downloads, time spent listening, etc. Some of the other key pieces of data you want to look at are the keywords users are searching on to find your content. Once you have that data, you can work on optimizing the detailed description, titles, and tags on those pieces of content to increase the organic traffic to those pieces.
But these platforms have the same limitations as the other social platforms and you’re better off exporting the data so that you have the ability to sort and compare different metrics in ways that the tools don’t allow.
Don’t Suffer From Data Paralysis
There are so many data points to track for each piece of content that you put out. Before you start collecting data or before you invest in a costly data/analytics solution, be sure you understand the reason you’re collecting and reporting that data and make sure you’re only spending your time with data that can deliver actionable insights.